The system calculates the service level number based on the standard deviation of the safety factor. The service level determines the amount of stock you want to guarantee to be in your warehouse. For example, you have a hardware store and you want AA batteries to be available 99.9% of the time. You make the AA batteries an A Ranked product with a service level of 99.9% and therefore a safety factor of 3.72. The system uses the calculated safety factor to determine the amount of safety days needed to provide the desired service level.
The most popular distribution level for determining probability is referred to as normal distribution. This term used in statistical analysis describes a distribution of numbers in which the probability of an occurrence, if graphed, follows the form of a bell-shaped curve.
Standard deviation refers to the spread of the distribution number. The system calculates this as follows:
Determine the mean of a set of numbers.
Determine the difference of each number and the mean.
Square each difference.
Calculate the average of the squares.
Calculate the square root of the average.
Note: In safety stock calculations, the forecast quantity is often used instead of the mean in determining the standard deviation.
The following table shows the service level and its corresponding safety factor using the above calculation process:
Service Level |
Safety Factor |
50.00 % |
0 |
55.00 % |
0.13 |
60.00 % |
0.25 |
65.00 % |
0.39 |
70.00 % |
0.52 |
75.00 % |
0.67 |
80.00 % |
0.84 |
81.00 % |
0.88 |
82.00 % |
0.92 |
83.00 % |
0.95 |
84.00 % |
0.99 |
85.00 % |
1.04 |
86.00 % |
1.08 |
87.00 % |
1.13 |
88.00 % |
1.17 |
89.00 % |
1.23 |
90.00 % |
1.28 |
91.00 % |
1.34 |
92.00 % |
1.41 |
93.00 % |
1.48 |
94.00 % |
1.55 |
95.00 % |
1.64 |
96.00 % |
1.75 |
97.00 % |
1.88 |
98.00 % |
2.05 |
99.00 % |
2.33 |
99.50 % |
2.58 |
99.60 % |
2.65 |
99.70 % |
2.75 |
99.80 % |
2.88 |
99.90 % |
3.09 |
99.99 % |
3.72 |
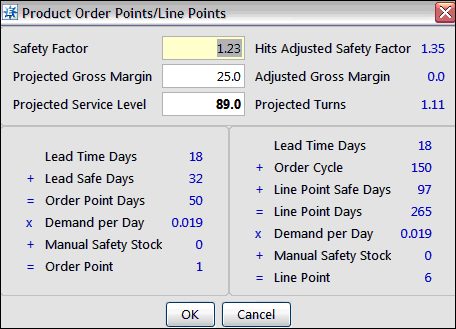
Following is an example of how the system handles a change to the Projected Service Level which updates the Safety Factor which then updates the Lead Safe Days calculated for the product.


The lead time for this product is 18 and calculated from received purchase orders.
The Hits Adjusted Safety Factor is using this calculation:
safety factor X (4 / annualized hits) + .6 = 1.35
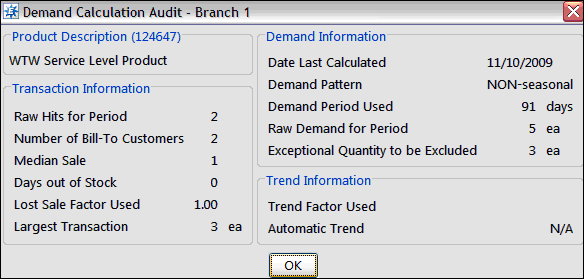
If there are no hits, the system uses 4 in the calculation. Annualized hits are calculated as follows: raw hits X 365 / Forecast Period
Since the Lead Time Days equal 15, then the normal safety days rules apply.
See Also:
How the System Calculates Line Point Safety Days