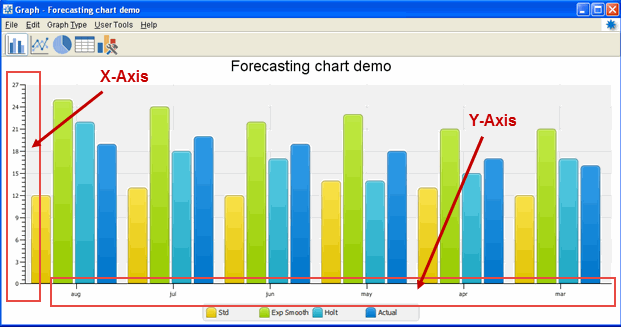
You can display the same data in different graph types without having to reselect the parameters you want to display.
To select the Solar graph type to display:
From any table in the system, such as a queue, right-click and select Create Graph to display the Graph Options window.
For some windows in the system the graphing icon displays next to data you can display in a graph. However, these graphs display using Flash applications and may not be available for all systems. ![]() See example
See example
Use the icons at the top of the window to select which graph type you want to create:

Bar Graph, Line Graph, or Pie Graph
The data icon displays the data in a table format: 
In the Graph Title field, enter the name you want to assign to the graph, such as Suggested P/O Queue for March 2013. By default, the system populates this field with the table name.
Use the Category (X-Axis) and Values (Y-Axis) check boxes to indicate how to setup your graph structure:

Note: Select only one X-Axis value. Choose as many Y-Axis values as are required to display your information needed.
Click Create to display your graph.
If the results are not what you expect, close the window to return to the Graph Options window and adjust your check box selections.
Use the Tools button  to adjust graph format options.
When you are finished formatting the graph, from the File menu, select one of the following:
Save as JPEG - Saves the file as a .jpg image for later use.
Print Options - Adjust margins and image settings before printing the graph.
Print Graph - Prints the graph to your default printer location.