After you create a graph, you can manipulate it to meet your presentation or reporting needs.
The Graph Options dialog box contains all of the features you can change, including:
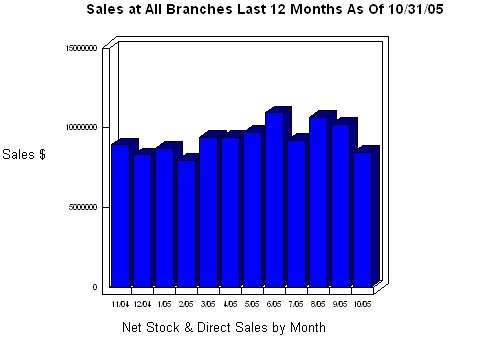
The Graph Type Gallery tab shows each of the graph types you can use to present your data: ![]() bar,
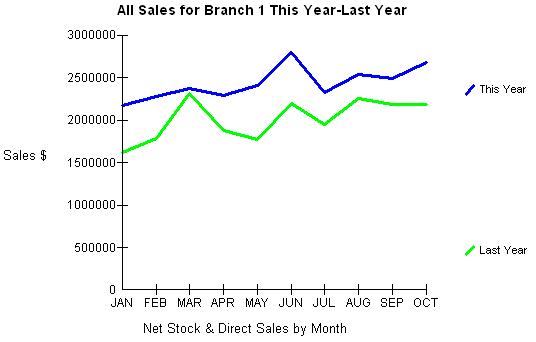
bar, ![]() line, or
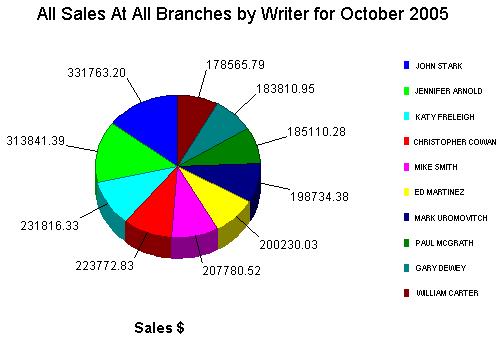
line, or ![]() pie chart.
pie chart.
When you create a graph, the system gives it the name of the window from which the graph data originated as a title. You can use the Titles and Text tab to change the graph titles, including the main title, the x-axis title, and the y-axis title, and to format the text style, color, and size.
If you want to redesign the color scheme of the graph to match your, or some other company's, corporate colors, use the Color Options tab. In this tab, you can change the color of the data elements, the graph axis, the grid, the border of a pie chart, and the background.
Use the Graph Scale & Display tab to do any of the following:
Increase or decrease the level of detail on your y-axis.
Increase or decrease the amount of space between your titles and the graph.
Increase or decrease the level of depth of your three-dimensional objects.
Display or hide the grid, labels, and data set averages.
Include or exclude negative values from your pie graph.
The form also includes a sample graph that shows what your graph looks like if you change the settings.
After you format the graph to meet your needs, you can either save it as a .jpg image file, or print it. If you save it, you can then import it into a report or presentation to help illustrate a point. If you print it, you can include it in a hard copy report or file it for future reference.
See Also:
Table Graphing Overview